rm(list=ls())#Simulating Geometric Brownian motion (GMB)tau <-1#time to expiryN <-1000#number of sub intervalsdt <- tau/N #length of each time sub intervaltime <-seq(from=0, to=tau, by=dt) #time moments in which we simulate the processlength(time) #it should be N+1
[1] 1001
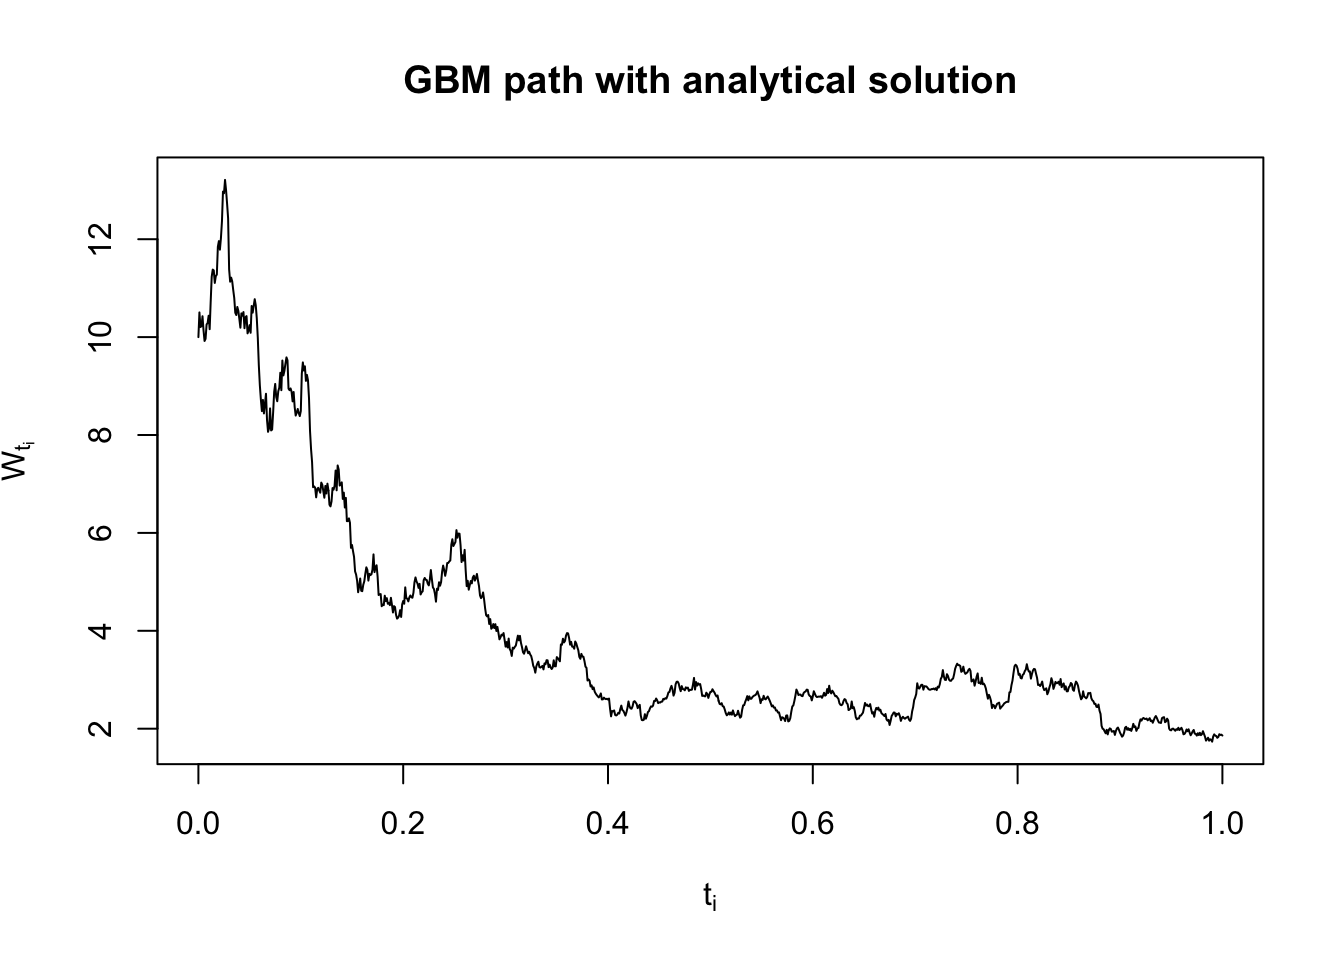
mu <-0.05#GBM parameter 1sigma <-0.9#GBM parameter 2X0 <-10#initial condition#simulate 1 Geometric Brownian motion pathZ <-rnorm(N, mean =0, sd =1) #standard normal sample of N elementsdW <- Z*sqrt(dt) #Brownian motion incrementsW <-c(0, cumsum(dW)) #Brownian motion at each time instant N+1 elements#Analytic solutionX_analytic <-numeric(N+1) #vector of zeros, N+1 elementsX_analytic[1] <- X0 #first element of X_analytic is X0. with the for loop we find the other N elementsfor(i in2:length(X_analytic)){ X_analytic[i] <- X_analytic[1]*exp(mu -0.5*sigma^2*i*dt + sigma*W[i-1])}#plot X against timeplot(time, X_analytic, type ="l", main ="GBM path with analytical solution", xlab =expression("t"[i]), ylab =expression("W"[t[i]]))
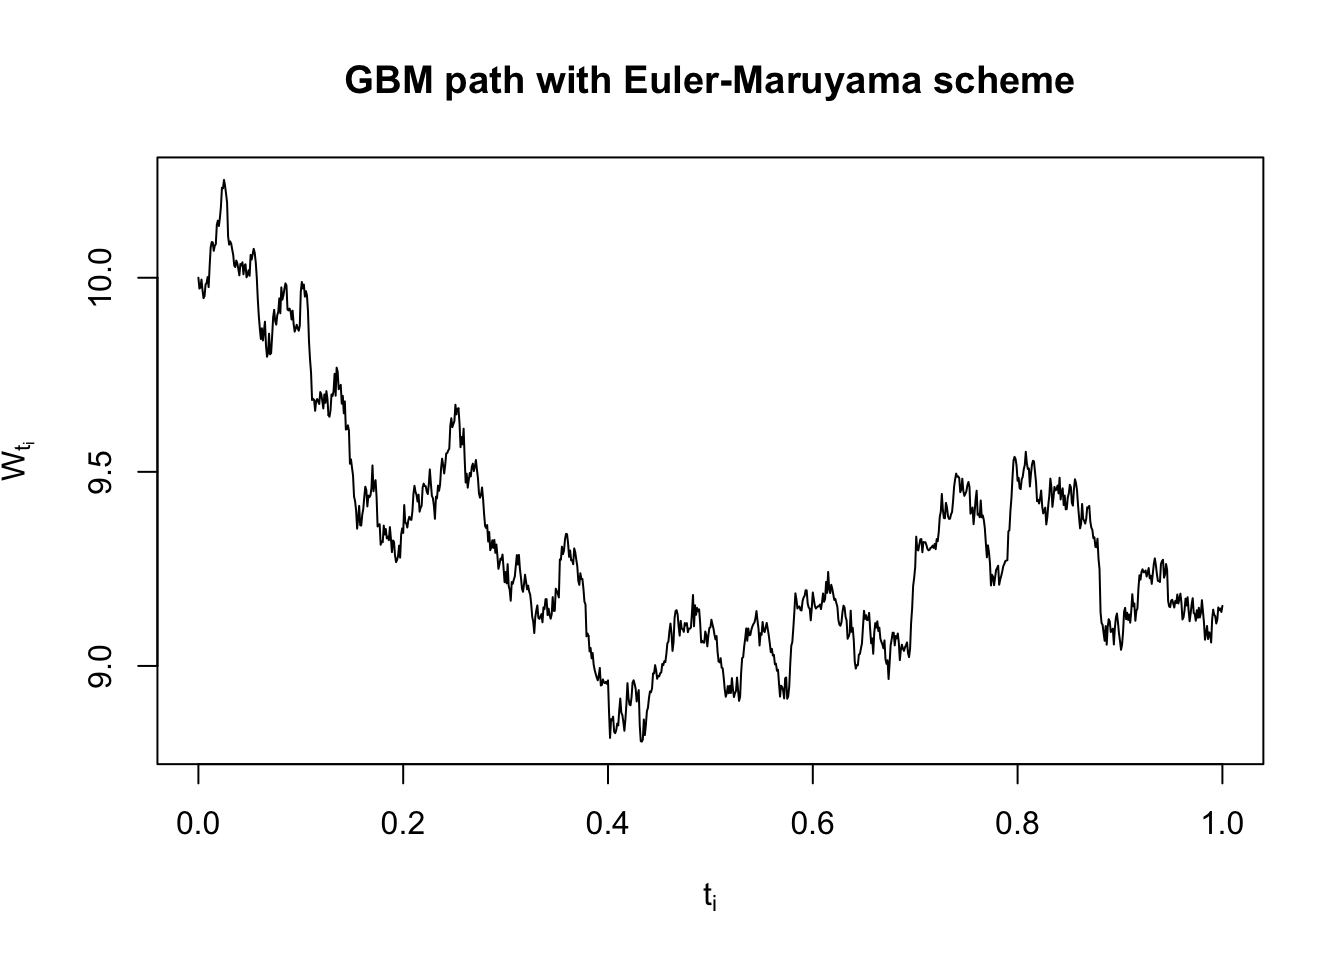
#Euler-Maruyama schemeX_EM <-numeric(N+1) #vector of zeros, N+1 elementsX_EM[1] <- X0 #first element of X_EM is X0. with the for loop we find the other N elementsfor(i in2:length(X_EM)){ X_EM[i] <- X_EM[i-1] + mu*X_EM[i-1]*dt + sigma*dW[i-1]}#plot X against timeplot(time, X_EM, type ="l", main ="GBM path with Euler-Maruyama scheme", xlab =expression("t"[i]), ylab =expression("W"[t[i]]))
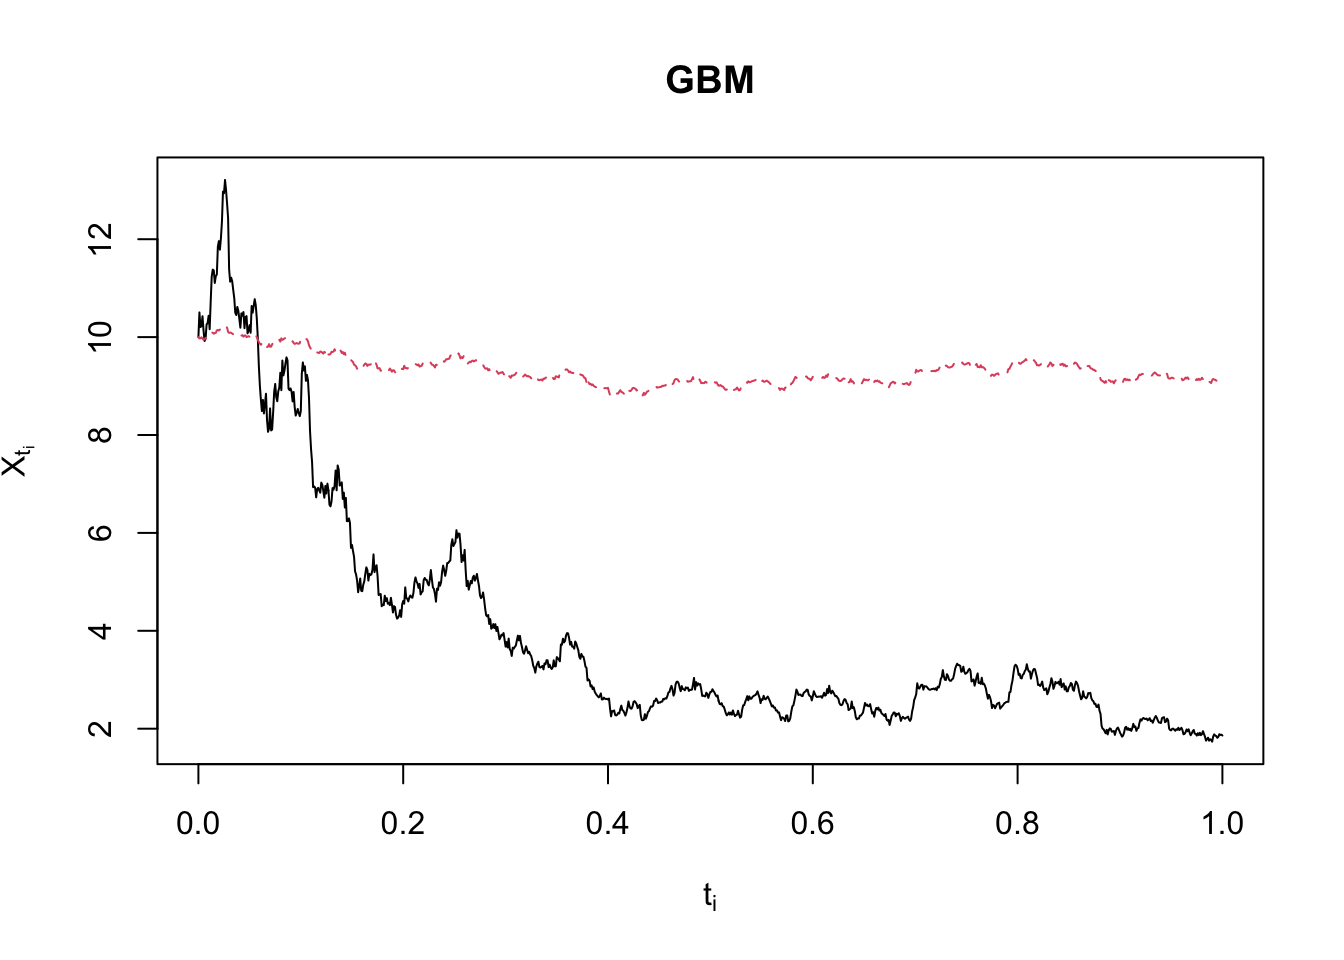
#plot W against timematplot(time, cbind(X_analytic, X_EM), type ="l", main ="GBM", xlab =expression("t"[i]), ylab =expression("X"[t[i]]))
Example 16.9. Let \(Z_0, Z_1, \ldots\), be a series of independent standard normal random variables. The infinite series \[
B(t)=\frac{t}{\sqrt{\pi}} Z_0+\sqrt{\frac{2}{\pi}} \sum_{m=1}^{\infty} \frac{\sin (m t)}{m} Z_m, \quad 0 \leq t \leq 1,
\] is a Brownian motion for \(0 \leq t \leq 1\). Try to simulate a Brownian motion stochastic process, at least approximately, by using finite sums of the form \[
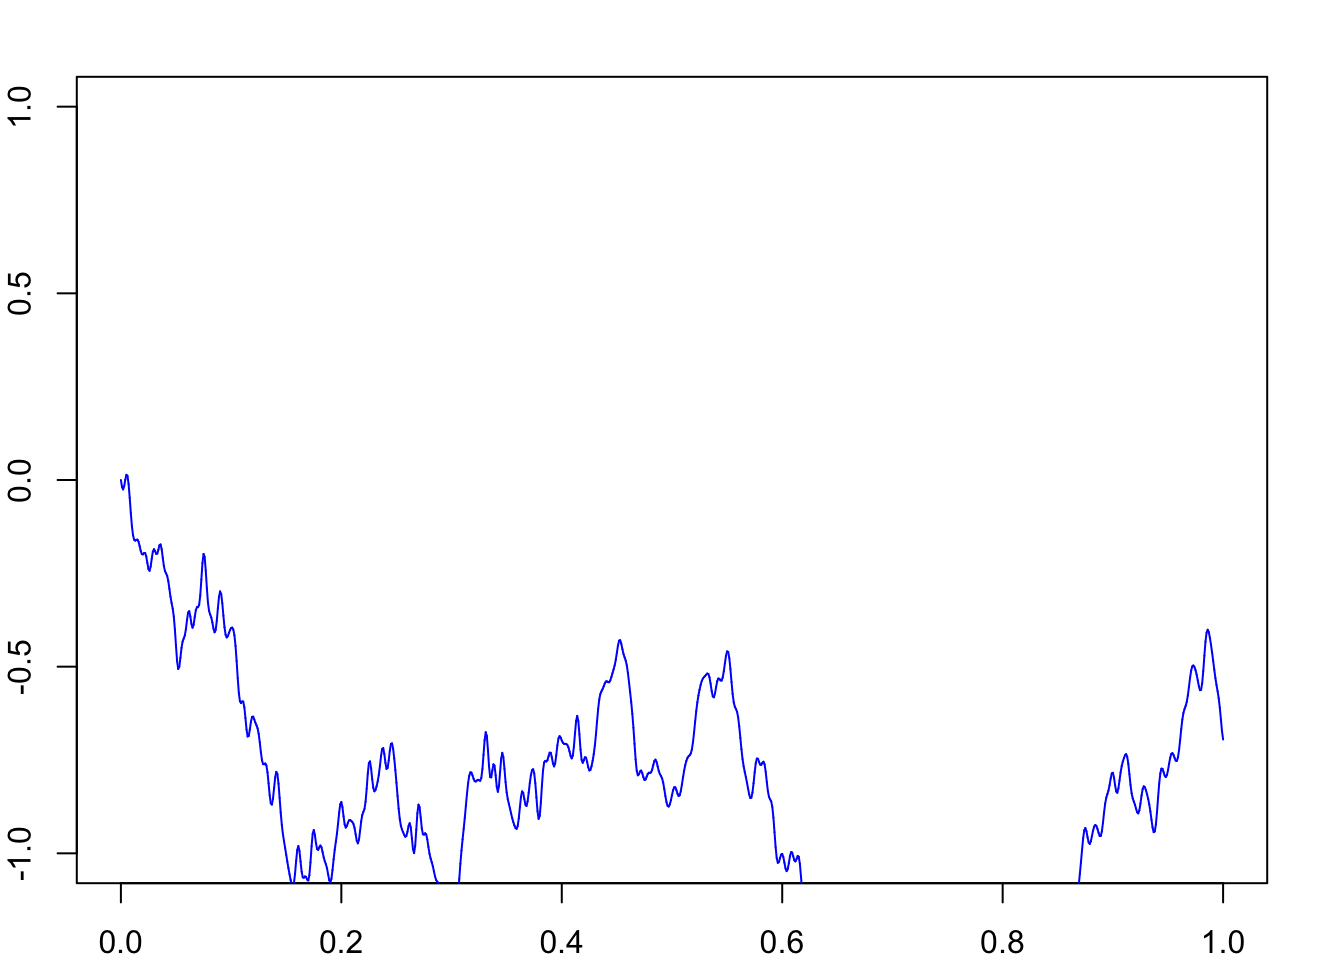
B_N(t)=\frac{t}{\sqrt{\pi}} Z_0+\sqrt{\frac{2}{\pi}} \sum_{m=1}^N \frac{\sin (m t)}{m} Z_m, \quad 0 \leq t \leq 1
\]